
LMS Analytics: 35 Essential Training Metrics to Track
LMS analytics help you track what really matters. This guide covers 35 essential LMS metrics to help you monitor progress, improve learning outcomes, and stay organized.

April 17, 2026
Your Learning Management System (LMS) is packed with data, but are you leveraging it to its full potential?
LMS analytics transform a simple training platform into a revenue-boosting engine. The insights they provide enable businesses to make comprehensive changes to their operations, training programs, and learning outcomes.
Whether you want to improve internal learning, or if your company offers learning as a service (LaaS), the right LMS analytics will not only help you evaluate the effectiveness of your learning programs but also align them with your broader business goals.
Keep reading, and we’ll review 35 LMS training metrics for enterprise businesses!
Why Should I Track My LMS Analytics?
Learning and development (L&D) is more than a simple business perk – it ranks as one of the strongest priorities for employees. In fact, research gathered by Whatfix states 68% of employees polled view training and development as the most significant policy of a company.
According to LinkedIn’s Workplace Learning Report 2025, 90% of organizations surveyed report learning opportunities as their top retention strategy. Even more, 84% of employees believe learning adds real purpose to their work. Investing in a quality LMS and learning program demonstrates true dedication to your employees and their futures.
Tracking and actioning the right metrics means utilizing your LMS to its fullest potential. After all, who doesn’t want to get the most from their systems?
LMS analytics enable businesses like yours to unlock a wealth of information about how learning and employee development affect broader business objectives.
Tracking your LMS analytics will help you:
- Improve lesson plans and outcomes
- Introduce personalized lesson paths
- Increase participation and engagement
- Produce a more compliant workforce
- Reduce skills gaps, so you can reach higher goals
As with any platform you use, the data will show whether you’re getting the most from it and highlight opportunities for improvement.
Learning and Development Metrics
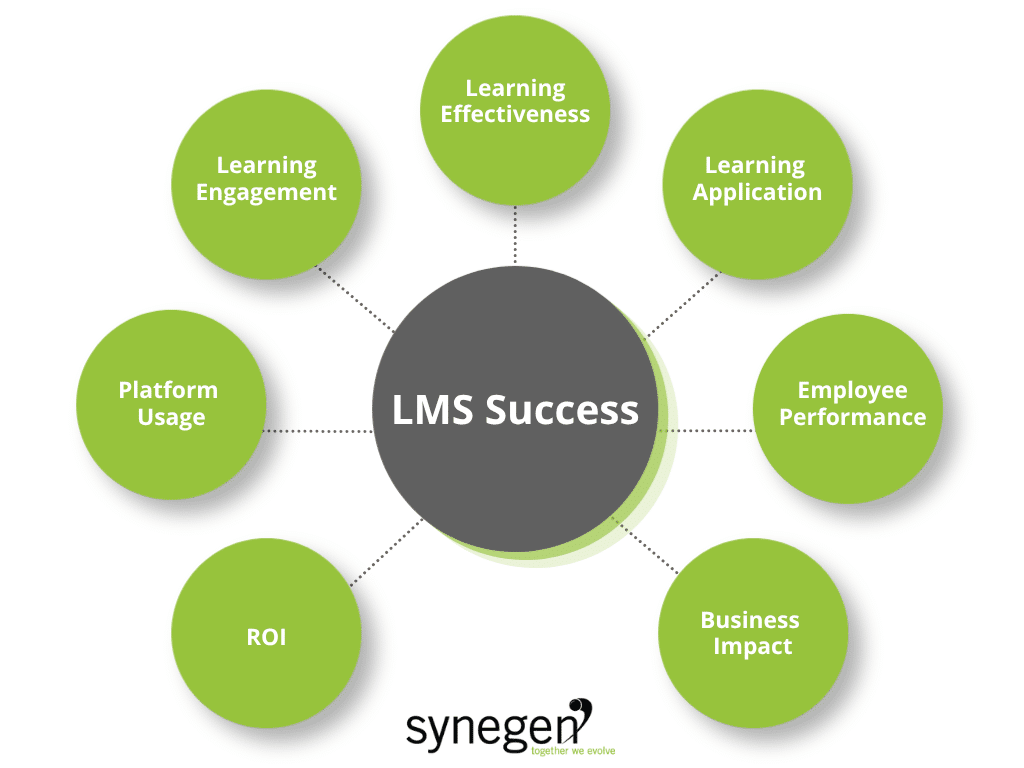
Let’s jump into the LMS analytics and training metrics! Below, we’ve outlined key training measurement categories and the essential metrics you can use to assess them.
No, you don’t need to track all of these metrics! LMS analytics are unique to each company: use this list as a starting point, explore your options, and fine-tune your measurement strategy as you get used to your LMS.
LMS Usage Metrics
LMS usage metrics provide valuable insights into user behaviors: what actions learners take, where they’re most and least engaged, and how they interact with the platform.
Tracking and evaluating these metrics makes it easier to identify potential access issues, navigation challenges, and underutilized areas of the platform.
While the quality of your training content is crucial, ensuring that your learning platform is user-friendly and accessible is equally important. If your LMS is cumbersome, slow, or difficult to navigate, it can significantly disrupt the learning experience and hinder everything from learner engagement to business impact.
1. Login frequency: Average number of logins per user.
Why: To understand current usage across the entire company and identify trends.
2. Active users: Number of users who logged into the LMS within a specific timeframe.
Why: This metric measures engagement by tracking who actually utilizes the platform beyond simply signing in.
3. Learning engagement: Tracks time spent on certain modules and interaction levels.
Why: For teams that want more specific insights into their LMS’s use and user behaviors.
4. Time spent on platform: Average time users spend on the LMS per session.
Why: To understand how much time is devoted to learning for specified time frames.
5. Course completion rates: Percentage of users who complete assigned courses.
Why: To determine course relevance, if they’re too easy or difficult, and whether learners are finishing mandatory classes.
6. Video completion rates: Percentage of users who watch videos in full.
Why: To understand if videos are interesting to learners and hold their attention. Videos where learners drop off are chances to revisit the course material.
7. Support ticket volume: Number of support requests related to the LMS.
Why: To understand if the platform is difficult to use, identify bugs, and find opportunities to streamline lesson plans.
Learning Engagement Metrics
Engagement metrics measure activity and participation within the platform. As you gather and study your LMS analytics, these metrics help us understand and improve learning course content, design, and structure.
Consider questions like these: Are people engaging with learning courses? Is a large percentage of learners dropping off after certain modules, quizzes, or videos, leading to incompletions? What types of lessons have the highest completion rates?
8. Active participation rates: Measurement of employee engagement in training activities.
Why: To gauge sentiment around training and if learners maximize their platform’s use.
9. Time spent on training: Average time spent on training content.
Why: To determine if users spend the expected amount of time on courses.
10. Drop-off rates: Points in the course where learners tend to stop engaging or drop out.
Why: To understand if the course material is interesting to learners.
11. Social learning interactions: Frequency of online discussions and collaboration.
Why: To gauge if the platform cultivates internal community and participation.
12. Gamification metrics: Measurement of engagement through game-based elements.
Why: To see how games perform against traditional exams and quizzes.
13. Learning path progression: Completion rates of entire learning paths or curricula.
Why: To measure if learners are completing required courses and if lesson plans and branches maintain interest.
Learning Effectiveness Metrics
Training effectiveness in LMS analytics refers to the degree to which a training program achieves its intended objectives.
Evaluating the effectiveness assesses the extent to which learners are acquiring the skills and knowledge necessary for better decision-making and long-term performance improvements, helping organizations determine whether their learning initiatives are driving the desired outcomes.
14. Time to complete training: Average time taken to complete training modules.
Why: This can help you set expectations for completions and understand if the course material is too easy or difficult.
15. Assessment scores: Scores taken from pre- and post-training assessments.
Why: To determine the overall difficulty of courses and if the material resonates with learners.
16. Knowledge retention: Ability to recall and apply learned content after a period of time.
Why: To gauge the long-term effectiveness of courses and their practical application in real-life situations.
17. Learner satisfaction scores: Learner perception of course design, structure, relevance, and likelihood of applying knowledge to job responsibilities.
Why: To understand learner sentiment and experiences using the platform.
18. Reattempt rates: How often learners retake quizzes or assessments.
Why: This metric highlights course difficulty, gaps in material or knowledge, and can identify opportunities for refresher or updated courses.
Learning Application Metrics
Learning application metrics focus on assessing how well individuals use the knowledge and skills acquired during training.
This involves evaluating how learners apply what they’ve learned to address challenges, complete tasks, and make decisions.
Successful application of these skills is a key driver of improved job performance, as it demonstrates the practical transfer of learning to the workplace. When employees consistently apply their training in their roles, it leads to tangible improvement in their performance.
19. Scenario-based assessments: Measure accuracy, completion time, error rate, and post-assessment application to evaluate learners’ ability to apply knowledge in realistic scenarios.
Why: To see how your learners translate lessons into real-world scenarios and applications.
20. Simulations: Track task completion rate, proficiency, error frequency, and real-world application to assess learners’ performance in a controlled, interactive environment.
Why: To see how learners apply lessons and learning; in a risk-free setting.
21. Decision-making exercises: Measure decision accuracy, justification quality, risk management, and decision speed to evaluate learners’ judgment and problem-solving skills.
Why: To ascertain if the courses give learners the confidence to make decisions on their own.
Employee Performance Metrics
In LMS analytics, job performance metrics evaluate the impact of training on an employee’s skillset and its use in real-life applications.
This involves assessing the application of acquired knowledge and skills and the resulting changes in productivity, quality, efficiency, or other key performance indicators (KPIs) that align with organizational goals.
Not all learning solutions offer built-in tracking for these metrics. Choose a platform that includes performance management features, like Totara. They offer metrics that measure competency management, goal tracking, and feedback from managers and peers. Teams who use Totara take full control of their LMS analytics, gaining valuable insights into the impact of training on job performance.
This data not only helps in assessing the immediate effectiveness of the training but also supports ongoing development efforts and aligns employee performance with organizational objectives.
22. Performance improvement: Increase in performance KPIs (e.g., sales, quality, safety).
Why: This determines if courses have a noticeable impact on output.
23. Post-training performance reviews: Performance reviews conducted by managers to evaluate improvements in actual job performance.
Why: These reviews help gauge the LMS’s impact on career progression and betterment.
24. Competency-based evaluations: Track whether learners are meeting performance standards after completing relevant training through competency models.
Why: These insights will determine if the course material is “sticky”.
25. Goal attainment rates: Percentage of employees who achieve specific goals, such as sales quotas or project milestones.
Why: These metrics highlight a learner’s growth and whether it’s time to set new goals.
Business Impact Metrics
Business impact metrics assess both the direct and indirect effects of training initiatives on organizational performance and strategic goals.
These metrics are essential for evaluating how effectively L&D programs contribute to broader business objectives.
Wondering how to track key LMS metrics? It’s important to note that tracking these metrics often requires data from other key business systems. While they may not be directly measurable within your LMS, a learning management software with seamless integration capabilities can facilitate the smooth flow of this data, making it easier to connect your training efforts with overall business performance.
Web development and integration experts like Synegen can help enterprise teams like yours maximize their LMS analytics and performance.
26. Revenue growth: Increase in sales or profit attributed to training.
Why: To confirm if, and how, the course impacts your team’s ability to boost profits consistently.
27. Customer satisfaction: Improvement in customer satisfaction scores.
Why: To determine if the courses affect your team’s problem-solving and action-taking ability.
28. Operational efficiency: Reduction in errors, defects, or waste.
Why: To uncover instances where your team has improved output.
29. Productivity: Increase in output or decrease in production time.
Why: To see if the lessons and new knowledge enable your team to work more efficiently.
30. Employee turnover: Reduction in employee turnover rates.
Why: To discover if the LMS correlates with retention.
31. Market share: Increase in market share or penetration.
Why: To establish whether the courses help your business diversify its offerings and stand out through a better-educated workforce.
Financial Return on Investment (ROI) Metrics
According to FinanceOnline, 72% of businesses that implement an LMS gain a competitive advantage.
Metrics on finances and ROI help teams assess how effectively the resources spent on training contribute to organizational goals and performance.
32. Compliance/risk management rate: The number of team members who are and are not up-to-date on mandatory license renewals.
Why: To gauge completion rates for required courses and to assess your current level of risk of noncompliance.
33. Training payback period: Time required to recoup training costs through increased revenue or cost savings.
Why: To determine how long it takes to see a performance improvement and regain LMS costs.
34. Revenue per course: Track the income generated by external courses.
Why: For LaaS companies, this metric helps them understand which courses impact profits and uncover opportunities to consolidate or add new lessons.
35. Training cost per learner: Total training expenses divided by the number of learners.
Why: To understand the cost of training per user.
Tracking LMS Analytics and Training Metrics More Efficiently
While they provide invaluable insights, LMS analytics can get complicated, fast. That’s why it’s essential to have a tool that provides the flexibility to measure a wide range of metrics when needed.
Synegen helps enterprise businesses just like yours customize and track the learning management metrics that matter most to your organization. We’re the superior Totara Learning implementation partner and custom software development expert in North America. Our solutions unlock complete control over L&D, training, and employee betterment.
Whether you’re focusing on completion rates, assessment scores, or advanced analytics such as knowledge retention, skill application, and long-term impact on job performance, custom software and integrations built by Synegen ensure you have the data you need at your fingertips.
Ready to get started? Book a consultation with our team today!
LMS Analytics FAQs
1. What are LMS analytics?
LMS analytics are data points collected from your learning management system that help measure user behavior, engagement, training effectiveness, and overall business impact of learning programs.
2. What is the difference between engagement and effectiveness metrics?
Engagement metrics track how learners interact with content, while effectiveness metrics measure how well learners understand and retain that content.
3. Can LMS analytics affect business outcomes?
Yes. Metrics like revenue growth, productivity, customer satisfaction, and employee retention show how training contributes to overall business success.
Beyond the Code Newsletter
Where technology moves beyond the build—to real business impact.
Every month, we break down how integrations, automation, and real-time data flow can solve messy business problems and drive actual growth.
Related Content